Analysing results
Energy balance
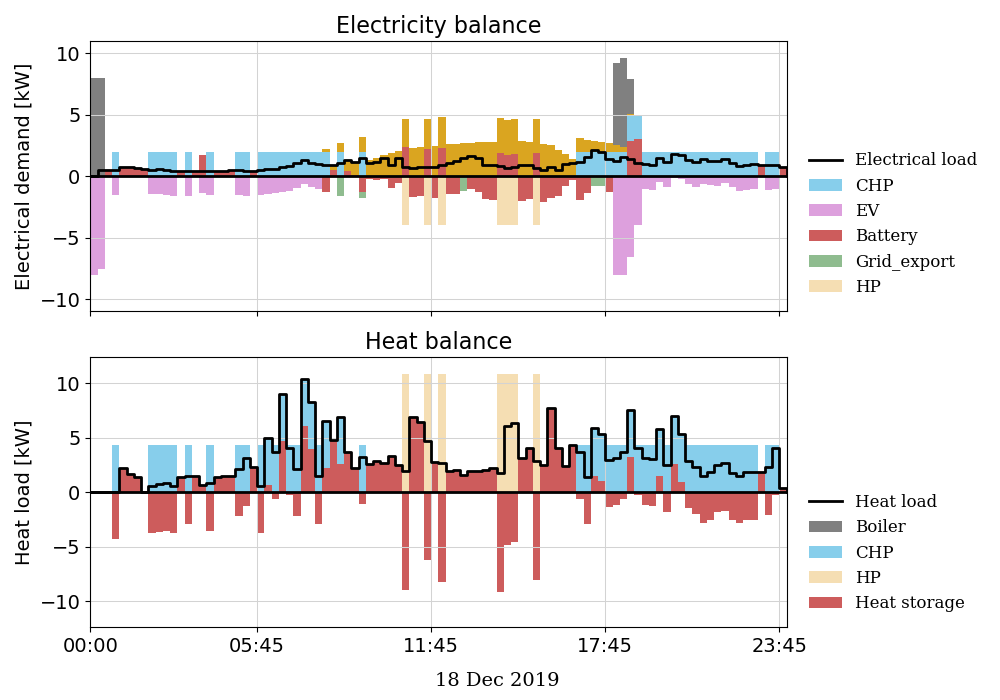
Upper subplot shows the electricity balance and lower subplot for heat balance
Bars in positive direction indicate the supply of commodities
Bars in negative direction mean consumption
Colors of bars indicate different household devices.
Thick black line represents the electrical/heat load
State of charge
State of Charge of the following devices are shown here as combined subplots.
Battery storage system (BSS)
Electric vehicle (EV)
Heat storage system (HSS)

Device flexibility
To understand device flexibility one specific device is discussed here. The following section discusses about the flexibility of a battery storage system.
Battery Flexibility

Upper subplot shows the cumulative energy (electricity) consumption/generation[kWh]
Lower subplot for flexibility power and prices
Black line represents the cumulative energy consumption/generation [kWh] in the optimal schedule.
Red lines mean positive flexibility, while blue lines indicate negative flexibility.
Color of flexibility power and price corresponds with the upper subplot